Overview
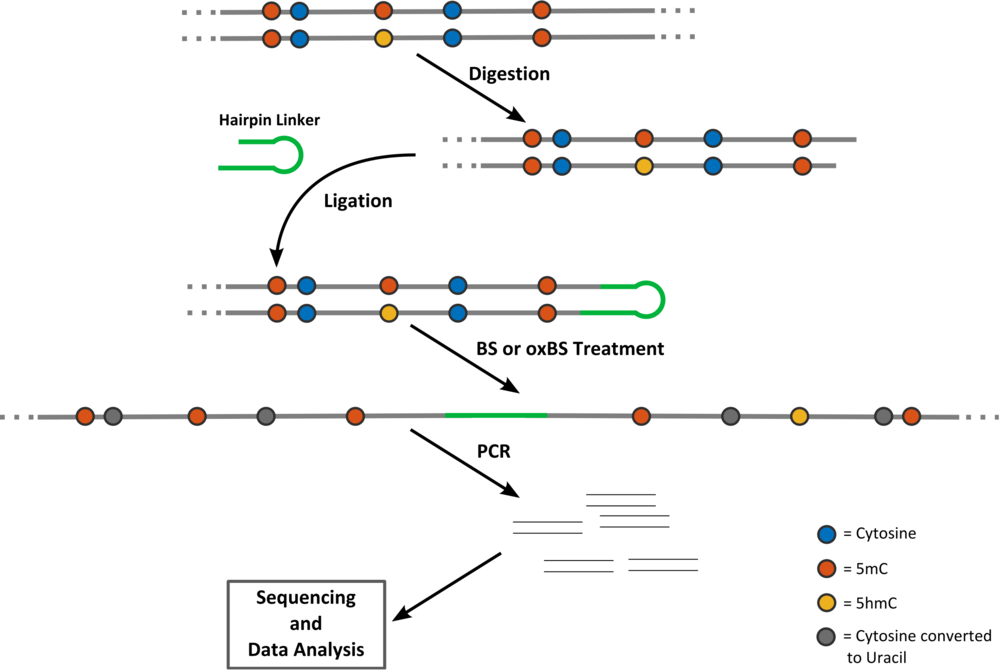
H(O)TA is a Matlab based tool that allows biologists to accurately measure the methylation and hydroxylation levels at a certain locus of the DNA and to determine the efficiencies of the enzymes that are responsible for maintenance (Dnmt1) and de novo (Dnmt3a/b) methylation as well as hydroxylation (Tets) at this locus over time. H(O)TA uses time course data from hairpin (oxidative) bisulfite sequencing and the estimation is based on a HMM that takes into account all the possible conversion errors of the two methods. For single time points constant levels of (hydroxy-)methylation can also be determined.
Download & Installation
H(O)TA is available for Linux, MacOS and Windows systems. Downloading the following installation files you will get instructions how to install H(O)TA and Matlab Runtime which is necessary for the executable to run. The download of the Matlab Runtime might take some time depending on your connection.
For Linux unzip the downloaded file and then execute
sudo ./HOTA_Installer_web.install
in the extracted folder. Once you have installed both H(O)TA and Runtime go to H(O)TA’s installation directory and run H(O)TA script by giving as an argument the path of the installation directory of the Runtime. E.g. if the version of the runtime is v901 and you have installed it in /usr/local/MATLAB then you have to type:
./run_HOTA.sh /usr/local/MATLAB/MATLAB_Runtime/v901
being in the directory of run_HOTA.sh.
Input Files
The names of the files containing the bisulfite and the oxidative bisulfite data should strictly be of the form region_BS.txt and region_oxBS.txt, respectively, where region is the name of the examined locus. The file containing the data of the conversion errors should have the ending _errors.txt but not does need to begin with the name of the specific locus in case. All the entries in the data and error files should be comma-separated without empty spaces. Clicking on the question marks of the GUI next to each loading button the user can see sample input files. For the tool to run the only required file is the bisulfite file. In case oxBS data is not provided the tool only predicts methylation levels (and the corresponding efficiencies) ignoring hydroxylation. Note that in this case the estimated efficiencies might (wrongly) compensate for the lack of hydroxylation information. E.g. the maintenance might appear to decrease, even though this does not happen in the real system. In case the error file is not provided, default error values (based on averages of historical values) are used.
BS and oxBS data Files:
The format of the BS and oxBS data .txt files is extremely simple. Every row of the file corresponds to the measurements that have been taken for a particular time point and a particular CpG (first and second column respectively). After the first row with six column headers day,CpG,TT,TC,CT,CC;, the data is listed. The first column is the day of the measurement and the number of the CpG follows. The next four columns contain the absolute number of times the states TT, TC, CT and CC have been measured.
Error Files
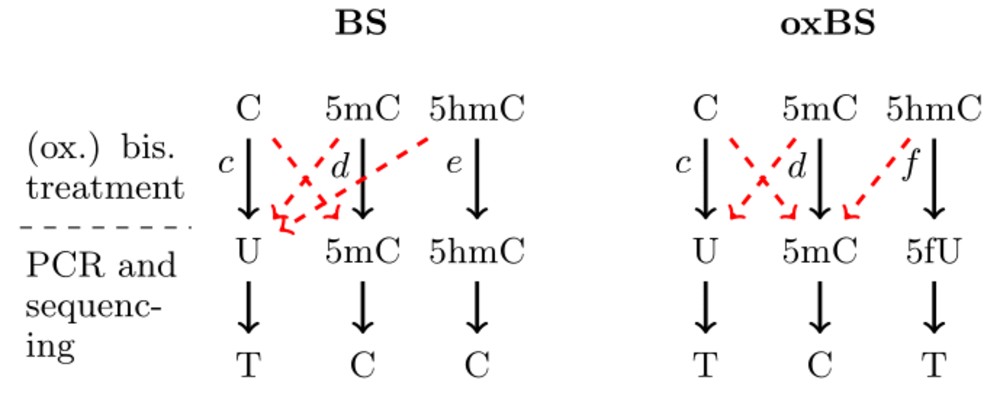
Each row of the error file corresponds to a time point (first column) of measurements. The second column is the label that appears for the corresponding time point in the output plots. Columns 3-5 contain the conversion errors of the bisulfite setup and columns 6-8 the conversion errors of the oxidative bisulfite setup (see Fig. left; each red dashed arrow corresponds to one error listed in the file from left to right). The last column of the error file is the characterization of the process that happens between two observation time points. This entry can either be rep or no-rep. In the first case we assume cell replication has happened while in the second no cell replication has happened.
Output
Once the data has been loaded a panel with a checkbox for each CpG of the locus appears. The user has to check the CpGs for which he would like to have estimations of the (hydroxy-)methylation levels and the activity of the enzymes. Regardless of the choice for the single CpGs the prediction of the behavior of the whole imported region (aggregated data of all CpGs) will always run and the aggregated results will appear in the right part of the main output window. In the left part of the window the prediction for each chosen CpGs is shown. The user can zoom in on the results of an individual CpG choosing it from the pop-up window in the upper left part of the screen. The output for this CpG or the aggregated data can be extracted in both .pdf (export to .pdf button) and .txt (export to .txt button). At last, there is also the option that the user exports all the results (all CpGs plus the aggregated data) in a .zip-file (export all to .zip-file).